Newsroom

Albemarle Publishes 2025 Sustainability Report
The report highlights progress in stewardship, innovation and operational excellence.
 SustainabilityJune 05, 2026Albemarle Publishes 2025 Sustainability Report
The report highlights progress in stewardship, innovation and operational excellence.
 In The NewsMarch 31, 2026Insights in Lithium Chemistry: Shaping Advanced Rubber Materials
Lithium chemistry is fundamental in producing advanced rubber materials that are durable, elastic and resilient. It enables precise polymer engineering, improving performance across various industries including mobility, infrastructure and specialty products.
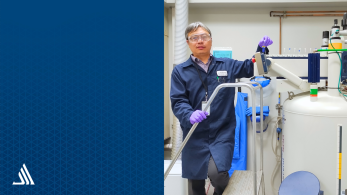 InnovationJanuary 14, 2026Expert Voices: The Science of Seeing the Invisible
Dr. Zhaoxiong (Norm) Zheng, a nuclear magnetic resonance (NMR) spectroscopy chemist at Albemarle’s Process Development Center in Baton Rouge, uses advanced imaging technology — not to scan bodies, but to analyze the molecular structure of specialty chemicals, helping teams across the company
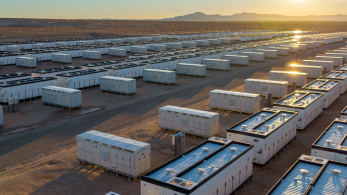 In The NewsMarch 31, 2026Grid Energy Storage 101: What It Is and Why It Matters
Demand for stationary energy storage is surging as countries strengthen grids and support the energy transition, with output expected to jump in 2026. AI and data centers are accelerating electricity demand, and lithium-based batteries help balance peak loads, reduce outages, and delay grid upgrades


 Press ReleasesJuly 23, 2026Albemarle Appoints Eduardo Bartolomeo to Board of DirectorsCHARLOTTE, N.C., July 23, 2026 /PRNewswire/ -- Albemarle Corporation (NYSE: ALB), a global leader in providing essential elements for mobility, energy, connectivity and health, today announced that its Board of Directors (the "Board") has appointed Eduardo Bartolomeo to the Board, effective July 21
- Press ReleasesJuly 21, 2026Albemarle Announces Quarterly Common Stock DividendCHARLOTTE, N.C., July 21, 2026 /PRNewswire/ -- The Board of Directors of Albemarle Corporation (NYSE: ALB) today announced that it declared a quarterly common stock dividend of $0.41 per share. The dividend, which has an annualized rate of $1.64, is payable Oct. 1, 2026, to shareholders of record at
- Press ReleasesJuly 07, 2026Albemarle Corporation to Release Second Quarter 2026 Earnings Results on Wednesday, August 5, 2026CHARLOTTE, N.C., July 7, 2026 /PRNewswire/ -- Albemarle Corporation (NYSE: ALB), a global leader in providing essential elements for mobility, energy, connectivity and health, announced today that it will release its second quarter 2026 earnings after the NYSE closes on Wednesday, August 5, 2026
- Press ReleasesMay 06, 2026Albemarle Reports First Quarter 2026 ResultsCHARLOTTE, N.C., May 6, 2026 /PRNewswire/ -- Albemarle Corporation (NYSE: ALB), a global leader in providing essential elements for mobility, energy, connectivity and health, today announced its results for the first quarter ended March 31, 2026. First Quarter 2026 and Recent Highlights (Unless


From Resources - Mine and Brine - To Market
Download our media fact sheet to learn the role Albemarle plays in the extraction, conversion and processing of lithium and bromine.
Press & Media Contact
For press & media inquiries, please contact our Media Relations team - for all other inquiries please go through the Contact Us page.