Newsroom

Values-Led, Purpose-Driven … and Data-Focused
Discover how two of Albemarle's sustainability champions—one in Charlotte, North Carolina, the other in Amsterdam, Netherlands—are pioneering innovative, data-driven strategies to propel the company's environmental initiatives and set new standards in sustainability.
 SolutionsMay 29, 2025From Lab to Life: Albemarle’s Expertise Enables Solutions for Modern Medicine
Among Albemarle’s specialty chemicals are a suite of tools for synthesis, which are solutions that enable the development of new drugs and help pharmaceutical manufacturers produce them at large scale.
 CommunityMay 15, 2025Albemarle Scholarship Program Helps Recipients Pursue College or Vocational School
Albemarle established the Gottwald Scholarship program in 2007 to make it easier for students to pursue their higher education dreams, whether at the university level or through vocational school.
 PeopleMay 07, 2025Expert Voices: Andy Odenthal Builds Production Facilities, Pilot Plants … and Concrete Canoes
Andy Odenthal builds things that defy expectations, from concrete canoes to modern and sustainable ways to extract critical minerals.
 PeopleApril 23, 2025How Albemarle R&T Manager Kevin Caple Went from Sneaking Cookies to Processing Chemicals
Kevin Caple's curiosity about science began at a young age when he discovered the cooling properties of aluminum foil under hot chocolate chip cookies, eventually leading him to pursue a career in chemical engineering and process improvements at Albemarle.


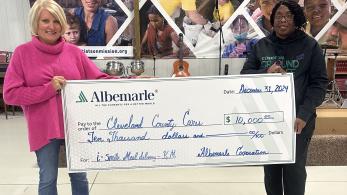 In The NewsFebruary 21, 2025Common Ground Cafe, Albemarle Grant Recipient, Featured
In celebration of Kings Mountain's 150th anniversary, the Albemarle Foundation awarded $150,000 in grants to local nonprofits. One recipient, Common Ground Café, an organization dedicated to providing nutritious meals to seniors in need, is using these funds to expand their services from Shelby to
 In The NewsJanuary 02, 2025Albemarle's Wildlife Habitat Plans Receive Recognition
The Charlotte Observer recently featured Albemarle's efforts to help save one of North Carolina’s smallest bat species, the tricolored bat.
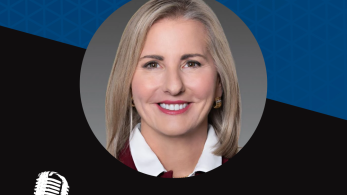 In The NewsNovember 04, 2024Albemarle's Melissa Anderson Speaks on Inclusive Culture in Election Season
Albemarle's Melissa Anderson spoke with NPR about how Albemarle fosters an inclusive culture through our core values, ensuring employees engage safely and feel supported, particularly during U.S. election season.
 In The NewsSeptember 18, 2024Albemarle CEO Kent Masters Named to Power 100 Innovators
Albemarle's CEO recognized by the Charlotte Business Journal as a top leader.


 Press ReleasesJune 03, 2025Albemarle Publishes 2024 Sustainability Report, Updates Efforts to Reduce Carbon Footprint, Manage Freshwater Responsibly and Support Customers' Sustainability GoalsCHARLOTTE, N.C., June 3, 2025 /PRNewswire/ -- Albemarle Corporation (NYSE: ALB), a global leader in providing essential elements for mobility, energy, connectivity, and health, today published its 2024 Sustainability Report. Entitled Values-Led, Purpose-Driven, the report provides an update on
- Press ReleasesApril 30, 2025Albemarle Reports First Quarter 2025 ResultsCHARLOTTE, N.C., April 30, 2025 /PRNewswire/ -- Albemarle Corporation (NYSE: ALB), a global leader in providing essential elements for mobility, energy, connectivity and health, today announced its results for the first quarter ended March 31, 2025. First-Quarter 2025 and Recent Highlights (Unless
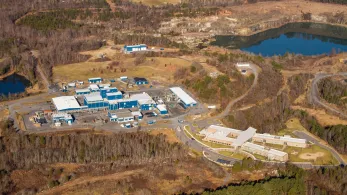 Press ReleasesSeptember 24, 2024Albemarle Submits State and Federal Permits for Potential Redevelopment of the Kings Mountain MineProject achieves a key milestone in the company’s phased approach to the mine’s redevelopment CHARLOTTE, N.C. , September 24, 2024 - Albemarle Corporation (NYSE: ALB), a global leader in providing essential elements for mobility, energy, connectivity, and health, has submitted several state and
 Press ReleasesSeptember 13, 2024TIME Magazine Names Albemarle One of the World's Best CompaniesAward recognizes company's high employee satisfaction, revenue growth and sustainability CHARLOTTE, N.C., Sept. 13, 2024 /PRNewswire/ -- Albemarle Corporation (NYSE: ALB), a global leader in providing essential elements for mobility, energy, connectivity and health, announced today that TIME


From Resources - Mine and Brine - To Market
Download our media fact sheet to learn the role Albemarle plays in the extraction, conversion and processing of lithium and bromine.
Press & Media Contact
For press & media inquiries, please contact our Media Relations team - for all other inquiries please go through the Contact Us page.