Newsroom

Albemarle Publishes 2025 Sustainability Report
The report highlights progress in stewardship, innovation and operational excellence.
 In The NewsMarch 31, 2026Insights in Lithium Chemistry: Shaping Advanced Rubber Materials
Lithium chemistry is fundamental in producing advanced rubber materials that are durable, elastic and resilient. It enables precise polymer engineering, improving performance across various industries including mobility, infrastructure and specialty products.
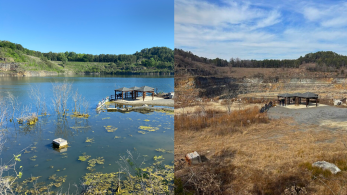 Albemarle Kings MountainMarch 12, 2026Kings Mountain Mine Dewatering Successfully Completed
Albemarle has successfully completed dewatering the Kings Mountain Mine open pit in North Carolina. The completion of dewatering marks a significant step forward for Albemarle’s long‑term plans at the site. As one of North America's largest hard-rock lithium deposits, the Kings Mountain mine has the
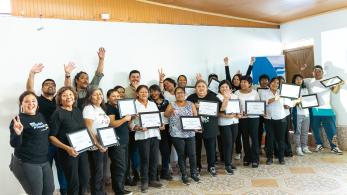 CommunityMarch 03, 2026Albemarle+Local: Building Shared Value and Opportunity in Chile
To strengthen our long-term presence in Chile’s Salar de Atacama region, Albemarle has introduced Albemarle+Local, a development program that brings together apprenticeships, local employability programs and local provider development under a single program.
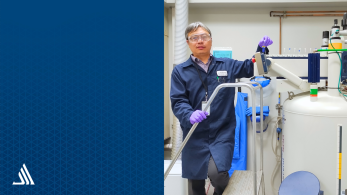 InnovationJanuary 14, 2026Expert Voices: The Science of Seeing the Invisible
Dr. Zhaoxiong (Norm) Zheng, a nuclear magnetic resonance (NMR) spectroscopy chemist at Albemarle’s Process Development Center in Baton Rouge, uses advanced imaging technology — not to scan bodies, but to analyze the molecular structure of specialty chemicals, helping teams across the company


 Press ReleasesMay 06, 2026Albemarle Reports First Quarter 2026 ResultsCHARLOTTE, N.C., May 6, 2026 /PRNewswire/ -- Albemarle Corporation (NYSE: ALB), a global leader in providing essential elements for mobility, energy, connectivity and health, today announced its results for the first quarter ended March 31, 2026. First Quarter 2026 and Recent Highlights (Unless
- Press ReleasesMay 05, 2026Albemarle Announces Quarterly Common Stock DividendCHARLOTTE, N.C., May 5, 2026 /PRNewswire/ -- The Board of Directors of Albemarle Corporation (NYSE: ALB) today announced that it declared a quarterly common stock dividend of $0.405 per share. The dividend, which has an annualized rate of $1.62, is payable July 1, 2026, to shareholders of record at
- Press ReleasesApril 06, 2026Albemarle Corporation to Release First Quarter 2026 Earnings Results on Wednesday, May 6, 2026CHARLOTTE, N.C., April 6, 2026 /PRNewswire/ -- Albemarle Corporation (NYSE: ALB), a global leader in providing essential elements for mobility, energy, connectivity and health, announced today that it will release its first quarter 2026 earnings after the NYSE closes on Wednesday, May 6, 2026. The
- Press ReleasesMarch 16, 2026Albemarle Corporation Announces Pricing for Cash Debt Tender OffersCHARLOTTE, N.C., March 16, 2026 /PRNewswire/ -- Albemarle Corporation (NYSE: ALB) (the "Company"), a global leader in providing essential elements for mobility, energy, connectivity and health, today announced the pricing terms for its previously announced cash tender offers (each, an "Offer" and


From Resources - Mine and Brine - To Market
Download our media fact sheet to learn the role Albemarle plays in the extraction, conversion and processing of lithium and bromine.
Press & Media Contact
For press & media inquiries, please contact our Media Relations team - for all other inquiries please go through the Contact Us page.